share · copy link · LinkedIn · X
By every number the library reported, the design system was in excellent health.
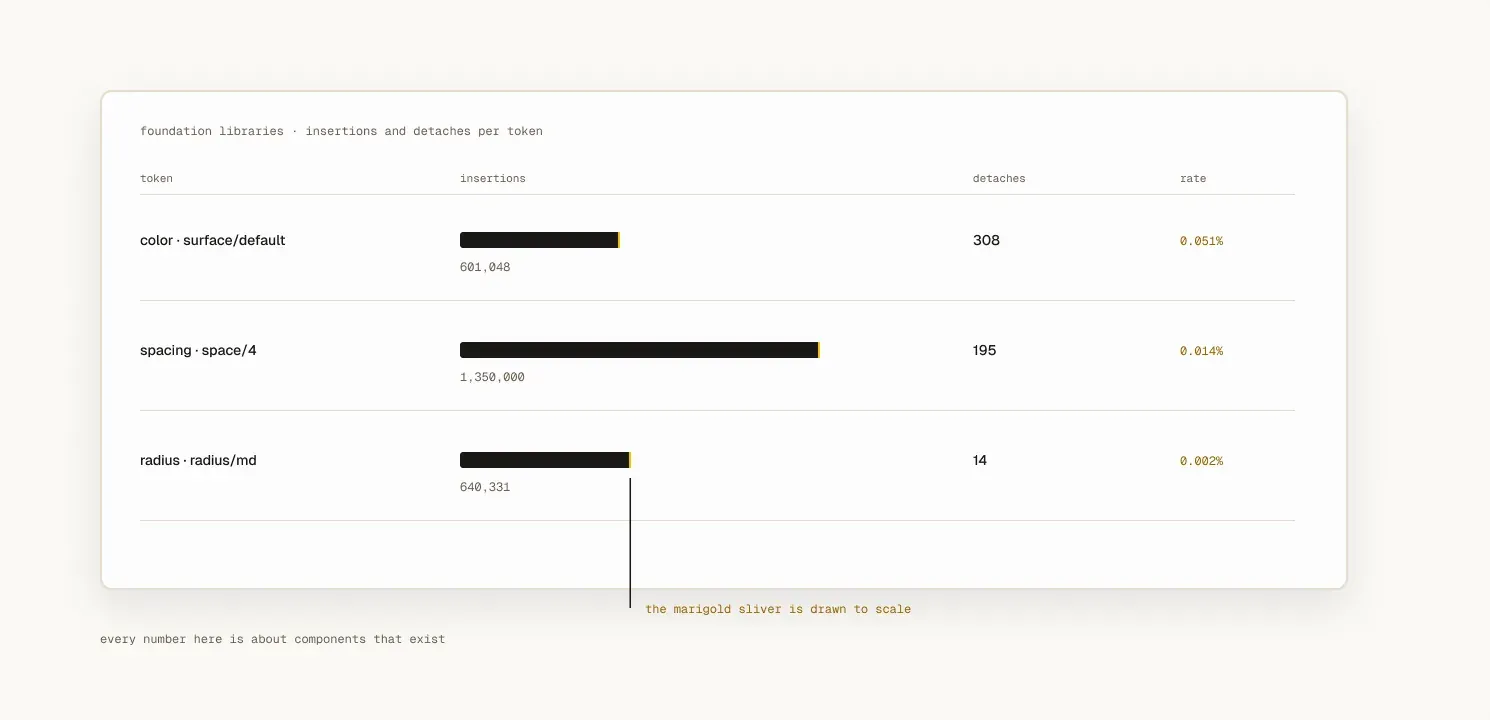
Detaching is what a designer does when a component nearly fits. It is the clearest signal of friction a library can produce, and across millions of insertions this one was running under a tenth of a percent. Nobody was fighting the system.
The system had a two-year hole in it that no number on that dashboard could see.
The thing the dashboard could not report
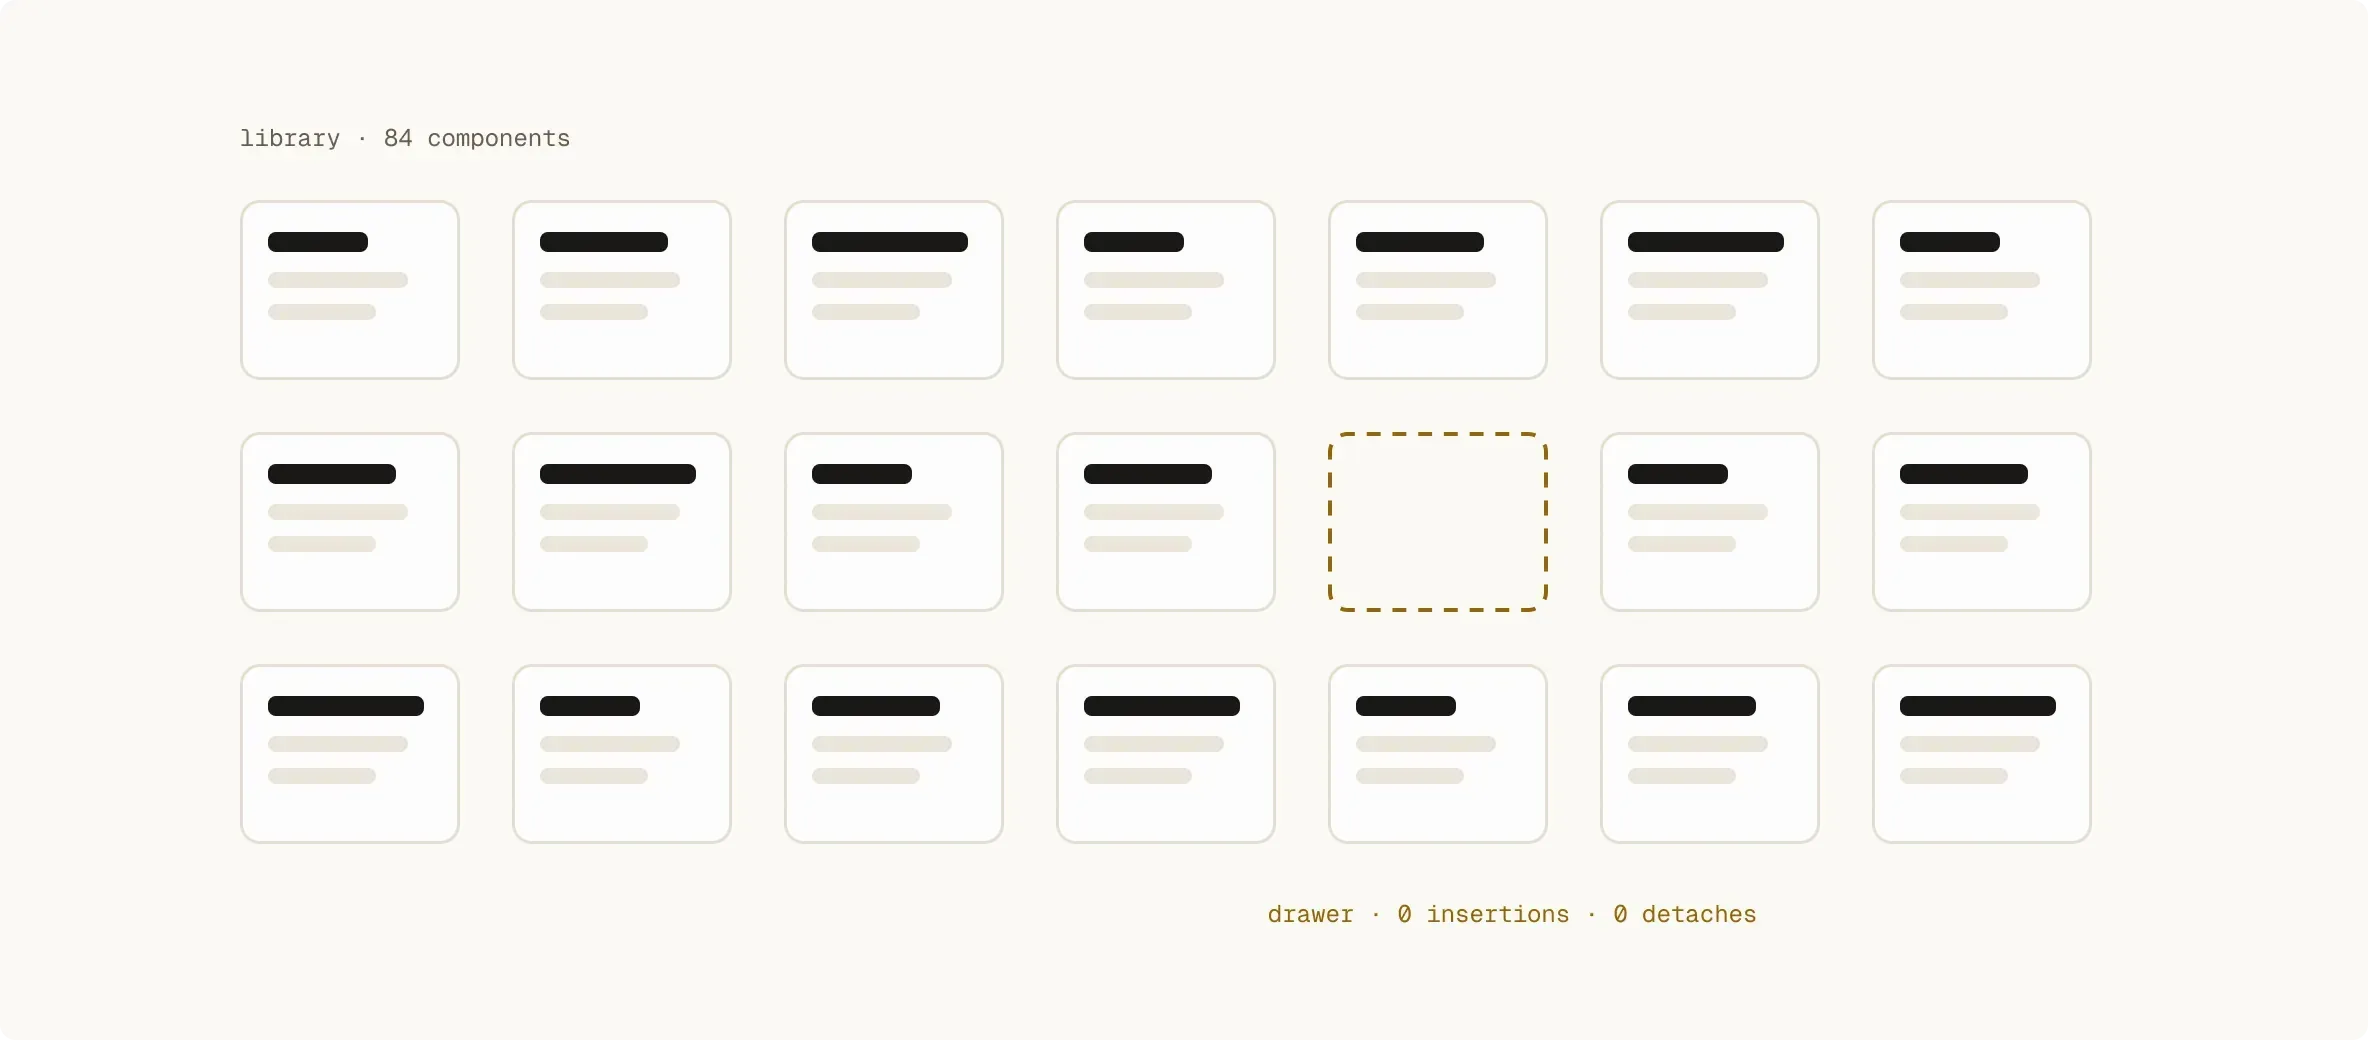
A modal header had been built as separate variants per breakpoint, each carrying a hardcoded width. That was a reasonable decision when it was made, and it held for two years. What it could not do was express a fourth width. A drawer is a modal at a different width, so a drawer required another variant and another hardcoded number. Nobody added one. So for two years, every designer who needed a drawer built one by hand in their own file.

Count what that cost. Every one of those one-offs was a component the system did not own, could not update, and never saw. None of them appeared as a detach, because nobody detached anything. You do not detach a modal to build a drawer. You open an empty frame. The most expensive gap in the system was structurally invisible to the metric that looked healthiest.
Why this is not a reporting bug
Every number a library reports is a number about components that exist. Insertions count the ones people used. Detaches count the ones that nearly fitted. Instance totals count accumulated use. All three describe the relationship between designers and the things you built.
A missing component has no relationship to describe. It generates no insertion, no detach, no instance, and no complaint, because the designer who needed it did not experience it as a gap in the system. They experienced it as a thing to draw, and they drew it, and the afternoon it cost them never surfaced anywhere you were looking. That is not an instrumentation flaw you can fix by adding a metric. It is what the instrument is.
Read the dashboard sideways
The insertion ranking is usually read as a popularity list. It is more useful read as a description of what the system is.
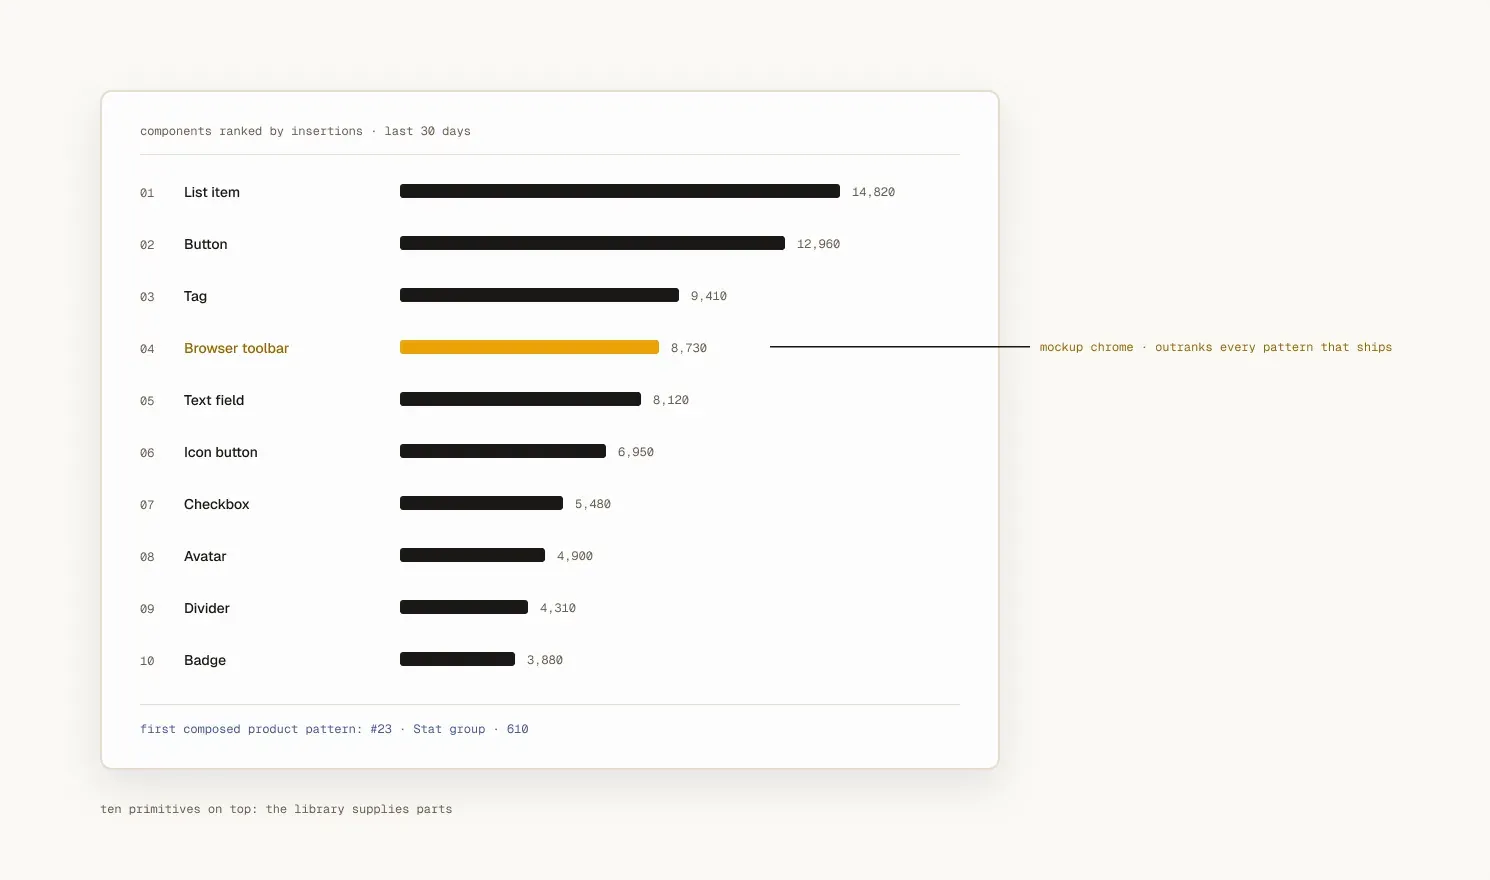
Primitives at the top and no composed patterns anywhere near them means one thing: the library supplies parts, and every product pattern is being rebuilt per screen. That is the same finding as the drawer, arriving from a different direction, sitting in plain sight on a dashboard people check monthly. The tell was that a component used only to dress mockups outranked everything that actually ships.
What I look at now
The ratio of primitives to patterns in the top twenty. If the top of your library is all buttons and inputs, your designers are composing the same patterns by hand every week and the library is not helping with the expensive part.
What is possible against what is built. Decode the library and compute, for every component, how many axis combinations could exist and how many do. Unbuilt combinations are not always gaps, but the pattern across components tells you where the structure is wrong. That is how the breakpoint fault surfaced, across four components at once. No query detected it. Reading a complete inventory did.
Product files, not the library. The one-offs live where the work happens. An hour spent looking at what designers drew by hand last month will tell you more than any dashboard. And the cheapest instrument available: ask. What did you build yourself last month because the system did not have it? Nobody files that as a ticket. Everybody can answer it.
What the numbers still will not tell you
Low insertions can mean dormant or it can mean finished. One component in this library showed 38,917 accumulated instances and zero insertions in thirty days. Nobody is adding it, and a great deal of live work still contains it. That is a deprecation problem, not a dead component, and the two want opposite responses.
And the window lies by omission. Figma reports either thirty days or twelve months. The system had been running about two years, so half its life was simply not in the data. Instance counts are cumulative, insertion counts are windowed, and quoting one against the other produces a number that means nothing.
The short version
Adoption analytics tell you how people use what exists. They tell you nothing about what people stopped asking for.
The second one is where the expensive failures live, because a missing component does not produce friction you can see. It produces a quiet afternoon of work in somebody else’s file, repeated for two years, invisible to a dashboard that says everything is fine.